[Tutorial] Simple plots
In this tutorial we will create a few, very simple plots.
Before we go, make sure that you have imported some demo data. We suggest to import demo MOCCA data which are used in this tutorial.
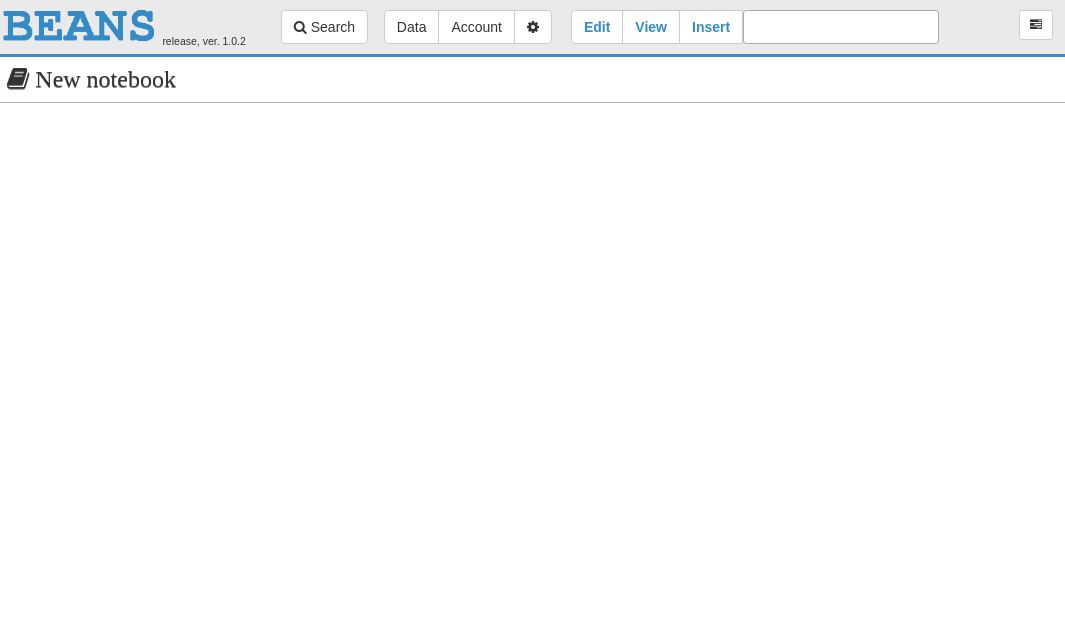
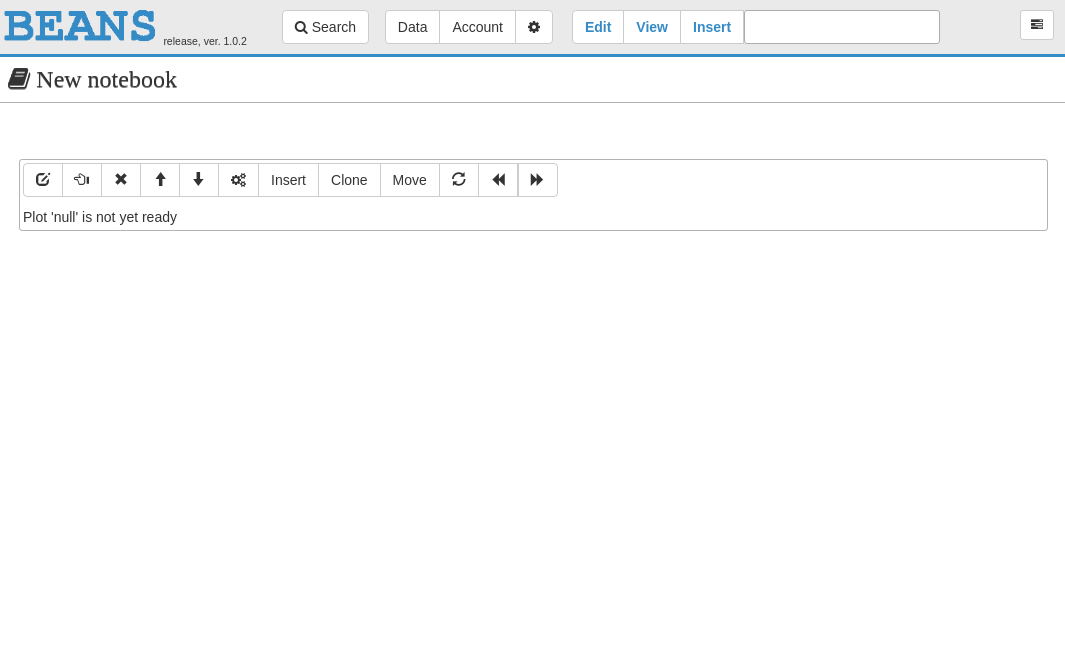
Open your BEANS instance, choose from the menu New notebook. This should create a new, empty Notebook for you, like this:
Now, let's create a plot with the total masses of two MOCCA simulations. From the technical point of view, it means plotting two columns from two BEANS tables.
Choose "Insert" from the menu. You should see a list of possible Notebook entries which you can add tho the notebook:
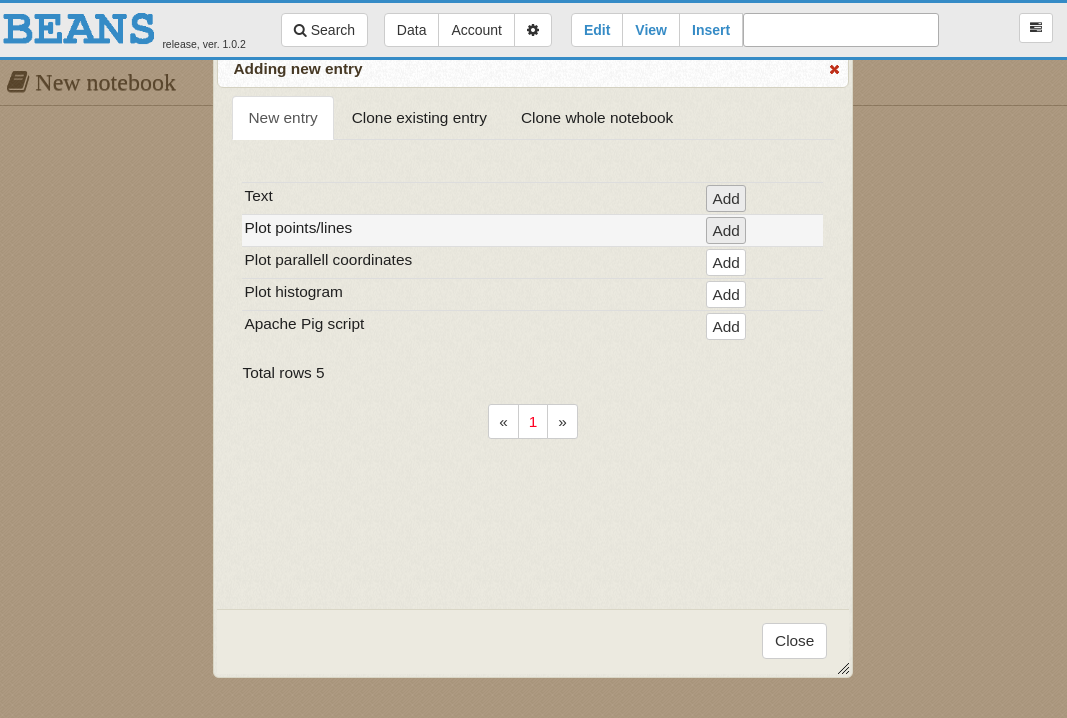
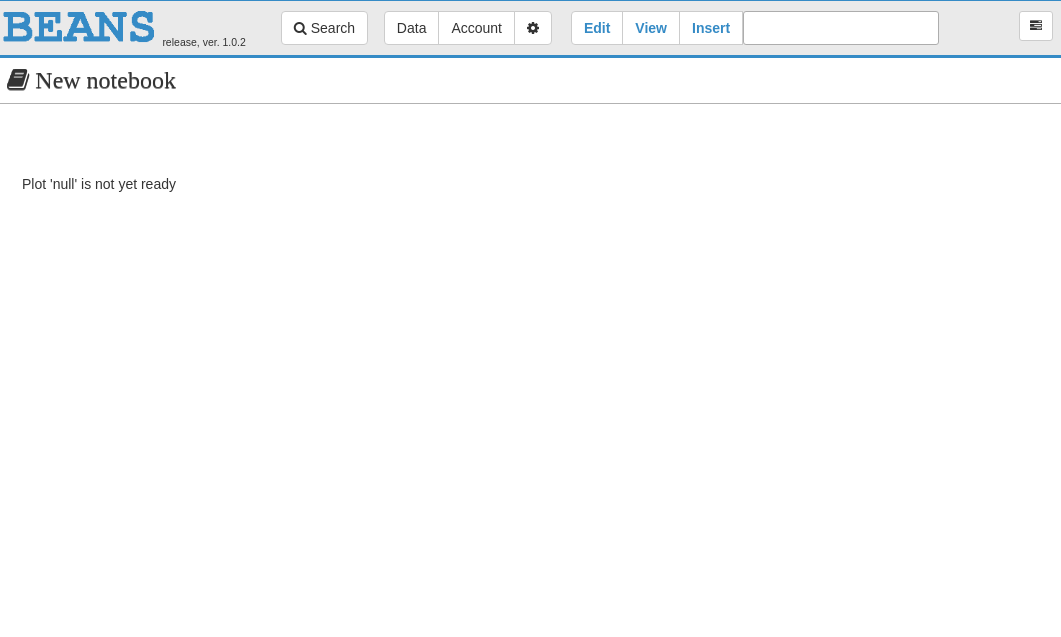
Choose Plot points/lines and click Add button. This operation should add new entry to the notebook:
Click on the newly created entry. The entry should get selected and an additional menu for this entry should appear:
These are the buttons which allows you e.g. edit, remove, move, clone this entry. Currently, we will concentrate only on editing and showing a simple plot.
Choose the first button, Edit item, and you should see edit view of this notebook entry:
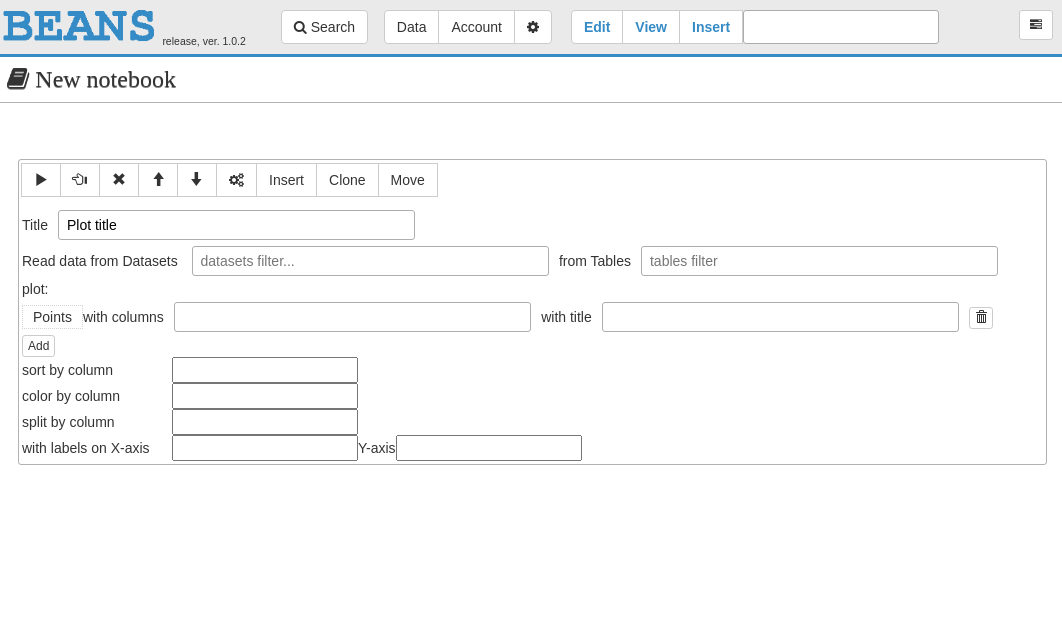
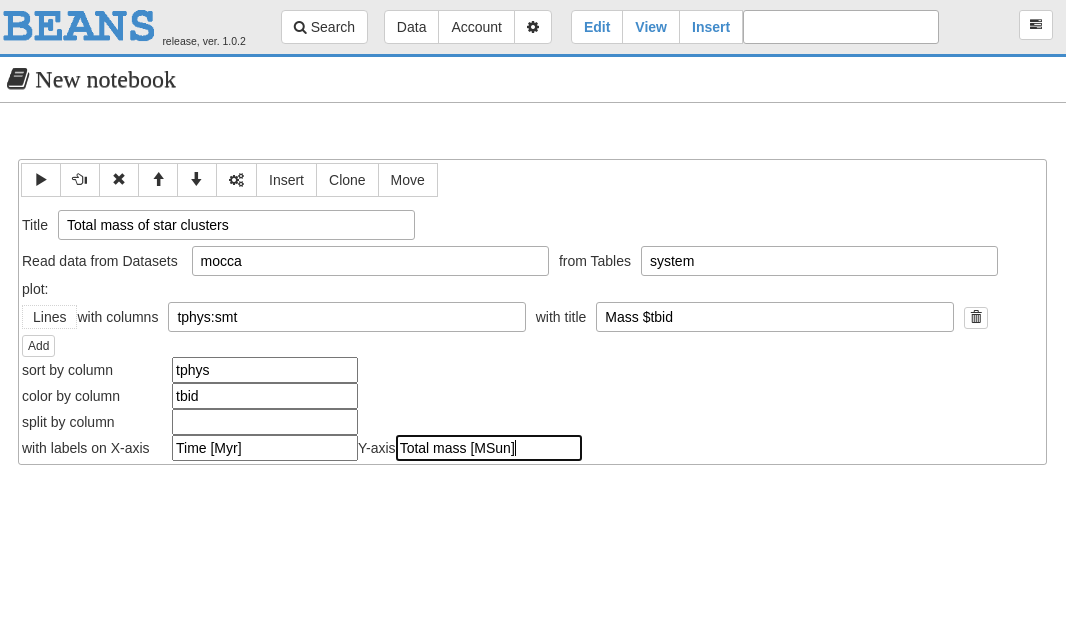
Let's type the following data into the plot:
Small explanation is needed for these input fields.
- the title is the title for the whole plot
- Read data from Datasets and from Tables defines queries to search for datasets and tables. Do you remember which datasets we have created in our demo datasets? We have created two datasets MOCCA conc_pop=0.1 and MOCCA conc_pop=3.0 with two files in each of them: system.dat and snapshot.dat. Thus, values mocca and system in our queries, should find two tables (system.dat) from out two datasets.
- with columns means which columns we like to plot. In our case on X axis we would like to have tphys (physical time of the simulation in mega years), and on Y axis we like to have smt (total star cluster mass in solar masses).
- with title defines how we want to create a legend for every line on our plot. The term $tbid will be replaced by the Table ID of our two tables.
- sort by column is needed to be sure that values on X axis are sorted by some column. In this way the line will be smooth. If you know gnuplot then it is obvious for you.
- color by column means which columns should be taken to split the plot into separate lines. We have two datasets, so we would like to have lines coming from different datasets plotted with a different color.
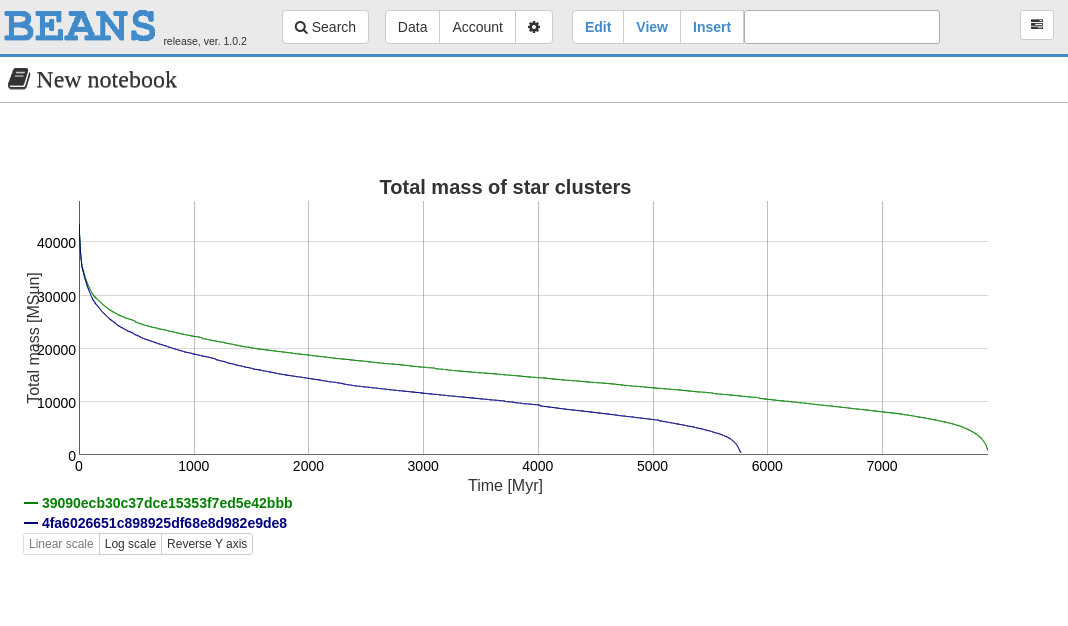
Eventually, we should get a plot which consists of two lines. Every line corresponds to one MOCCA simulation, coming from one datasets. The following plot should be produced: